

Understanding Our Prediction System: A Beginner's Guide
Understanding Our Prediction System
New to investing? No problem! This guide explains how we give you up-to-date information about BMNR when official reports can be weeks behind.
The Problem We Solve
Imagine you want to know how much your favorite company is worth today, but their official reports come out every few months. That's frustrating, right?
Here's what happens with BMNR:
So we have some current info (weekly updates + live stock price) but we're missing the key piece: how many shares exist today?
Without knowing current shares outstanding, we can't calculate important things like:
Our Solution: Smart Predictions
Think of it like this: if you know someone bought groceries but don't know their exact bank balance, you can estimate it by tracking their spending and income.
We do something similar with BMNR:
What we know week-by-week:
What we can predict:
What Are Those Dots on Our Charts?
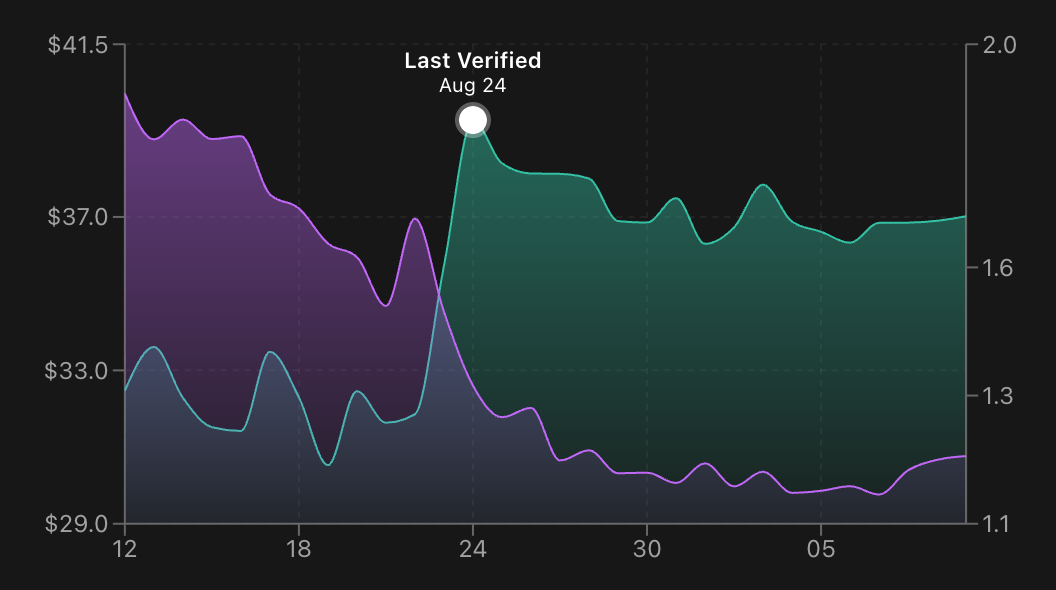
See those dots labeled "Last Verified" on our charts? They're super important:
This way you always know what's confirmed versus what's estimated.
How We Make Our Predictions (The Simple Version)
Let's break down our method step by step:
Step 1: Start with the Last Known Facts
We find the most recent official report that told us exactly how many shares existed. This is our "anchor point" - our rock-solid starting place.Step 2: Follow the Money Trail Week by Week
For each week since then, we track:Step 3: Calculate Today's Numbers
With our estimated current share count:A Real Example (With Made-Up Numbers)
Let's pretend we're tracking BMNR starting from August 1st, when they had exactly 50 million shares outstanding.
Week of August 8th:
We repeat this calculation for every week until today. Each week builds on the previous week's estimate.
Why Our Method Makes Sense
This approach works because:
It's like being a financial detective, following the money trail to figure out what probably happened.
What This Means for You as an Investor
The Good News
Things to Keep in Mind
How to Use This Info
Smart approach: Use our predictions to get a sense of current value, but remember they're estimates. When official reports come out, that's when you'll know for sure if we were close.Not so smart: Treating our predictions as gospel truth and making big financial decisions based solely on them.
What You'll See on Our Dashboard
All our charts show the same story:
Whether you're looking at market cap, shares outstanding, or ETH concentration, you'll see the same anchor dot date. This means all our current numbers are connected - they're all based on the same prediction starting point.
The Bottom Line
Think of our system like a weather forecast. Meteorologists use current conditions and historical patterns to predict if it'll rain tomorrow. We use current treasury data and market patterns to predict BMNR's current valuation.
Just like you'd check the weather forecast before planning a picnic (while knowing it might be wrong), you can use our predictions to get a sense of BMNR's current value while remembering they're educated estimates, not certainties.
The goal isn't to be perfect - it's to give you much better information than you'd have otherwise, updated in real-time as new data becomes available.
Questions? This stuff can be confusing at first. If anything doesn't make sense, or if you want us to explain other parts of our analysis, just let us know!